I’ve recently been harking back to my roots as a veteran Business Intelligence architect, which was pretty much the entirety of my working life before joining Consonance (leaving aside the brief Merchant Navy adventure, MFI warehouse work, and extensive Baskin Robbins experience, all of which threatened my life in one way or another).
And something that has been nagging at me for the past few years is how best to make the most of the data that we are storing for publishers. What insights could we deliver beyond the usual sets of static reports and (shudder) pie charts?
One challenge to overcome is the wide variation in the data that publishers store in the system. Clients using the royalties functionality are pretty well placed – in general they will have good quality book metadata, contact information, sales, advances, and royalties calculation results. That’s definitely something to work with.
For clients who do not need royalty functionality, or who have not got to that stage in their adoption, we might have inventory data fed directly from a distributor from which some estimation of sales might be gathered.
Or we might simply have metadata – products, prices, subject codes, publication dates, contributors, audiences, etc. That’s not too bad – we can visualise the publication schedule in terms of how many works and products are in the pipeline in comparison to historical trends, and dive into metadata completion.
The second challenge has been to find the right technology for the task. In the initial stages of exploring functionality I do not want to spend the time setting up a server on AWS, and performing data migrations. So I’m looking for a price-and-time-economical starting point that has the potential to scale later on, and needs the minimum of data preparation.
I settled on Tableau Desktop Personal Edition, which is currently priced at USD35 per user per month, and is an easy install (on Mac at least – I don’t see it being harder on Windows). Tableau also provide a free Reader application, which can be used to explore data exported as a package from Desktop, allowing me to try out some data analysis and share it with clients.
Lastly, how to access data? At Consonance we are rolling out very fast and efficient CSV-formatted downloads from the system for all clients (I just dropped 200MB of daily inventory data to my desktop in about 30 seconds). And a CSV format, done correctly, is a great start.
Onwards, to the visualisations …
I looked at sales data for a client who has implemented the royalties functionality, and has loaded aggregated sales data for quite a reasonable historical period of about eight years.
Here is a very small taste of the work so far.
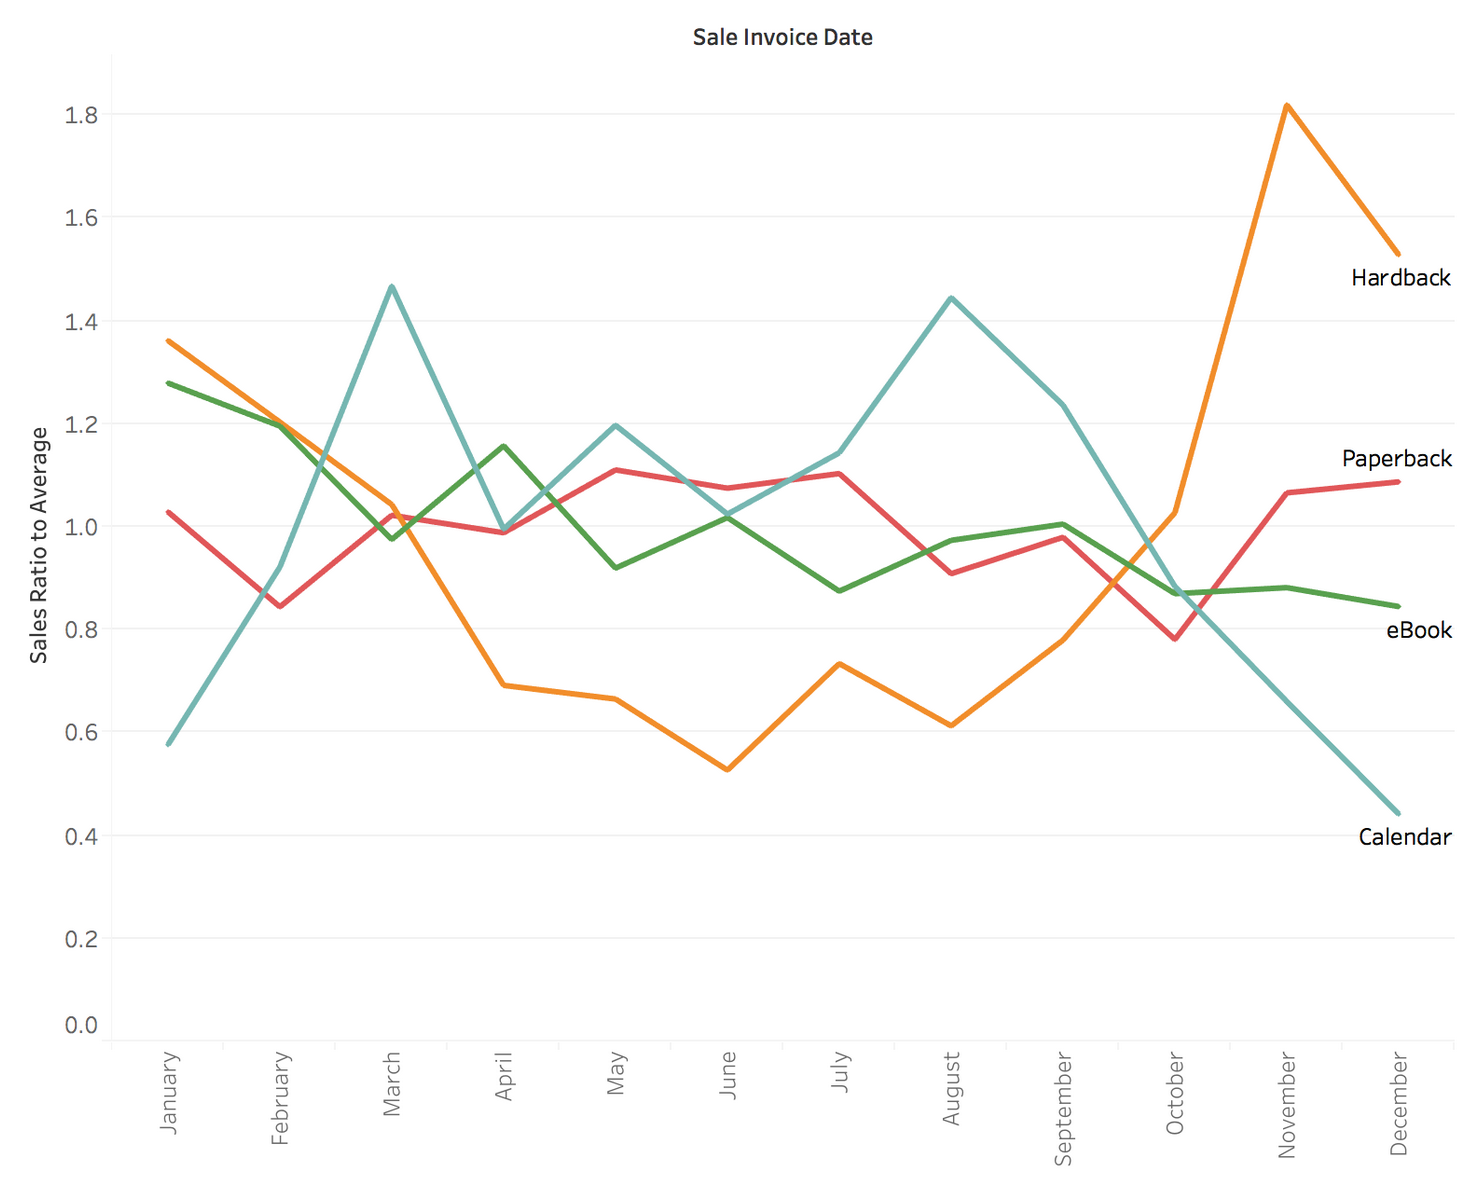
In What Part Of The Year Do Different Formats Sell?
Looking at the seasonality of sales by product form, the stand-out here is the relatively high level of hardback sales around the Christmas sales period – November sales are three times the June sales. Is that a surprise to anyone? We all know that everyone loves a hardback for Christmas.
And it’s trivial, of course, to look at this by subject, and to look for confirmation that biographies of football managers might be more prone to this effect than romance fiction.
On the face of it, that looks like an open-and-closed case, but there’s quite a list of caveats with this. Not the least of those is which month of the year the products are most likely to be published in.
When Do We Publish Different Formats?
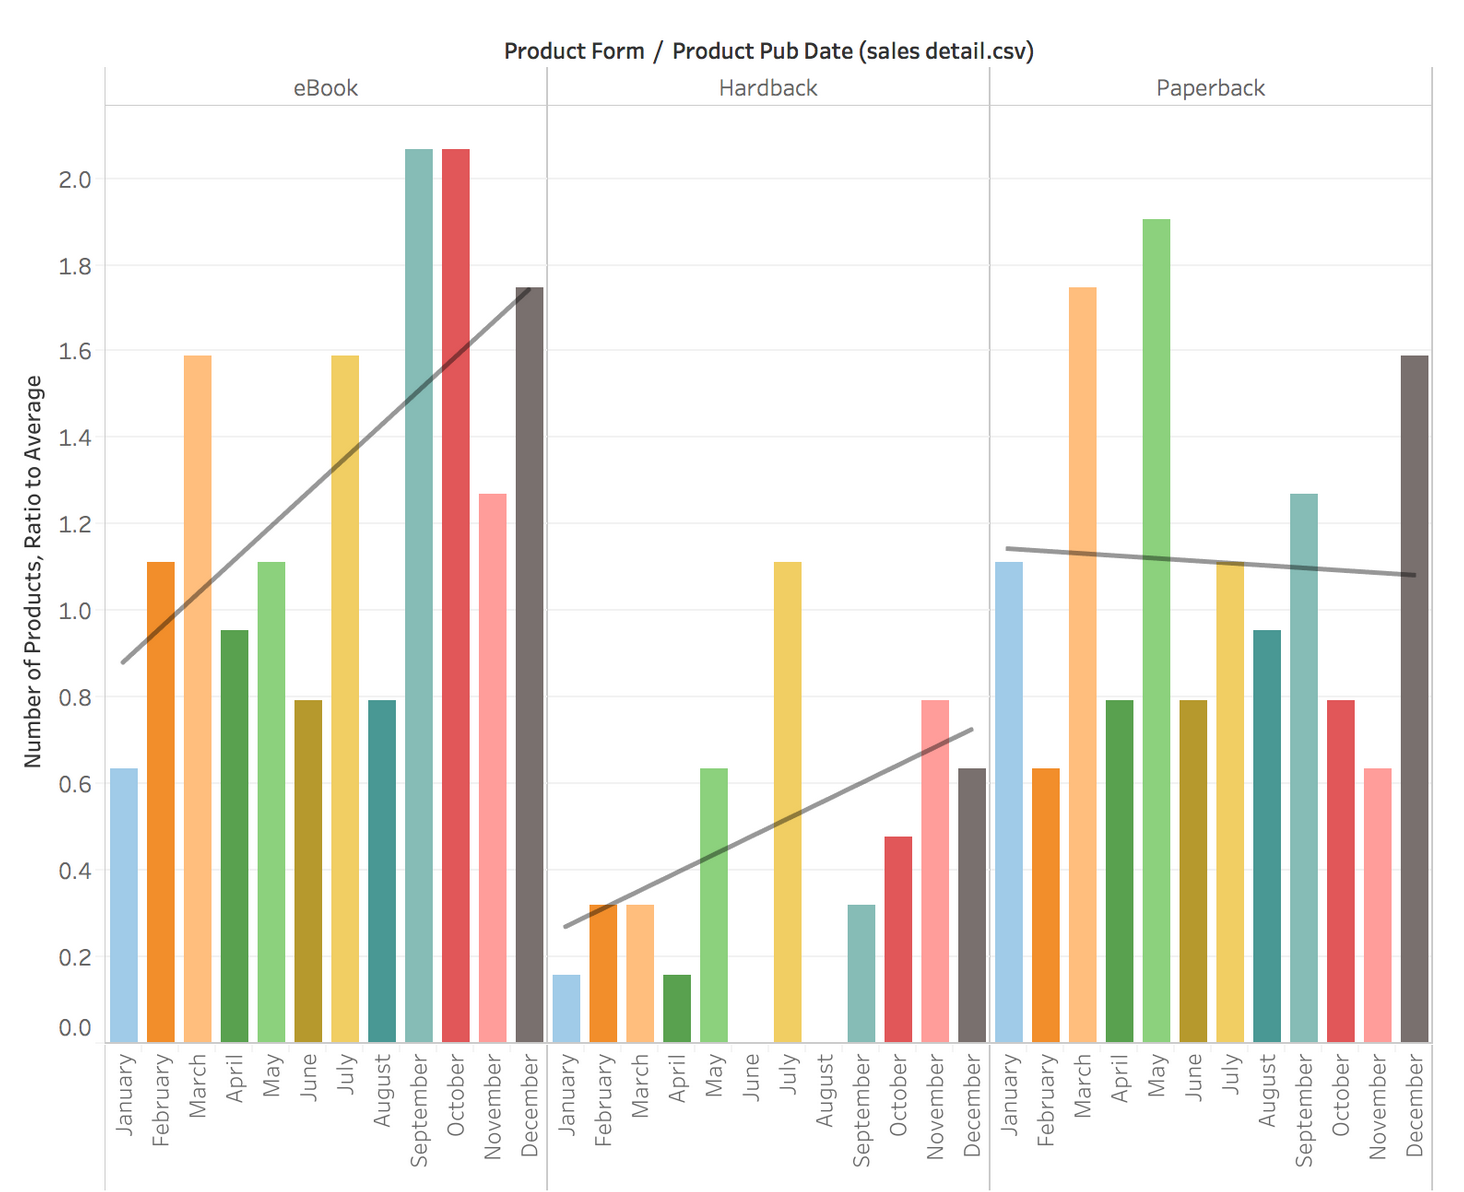
Which would not be relevant if it weren’t that the post-publication sales profile for hardbacks was so peaky…
Do Hardback Sales Decline Faster Than Paperback?
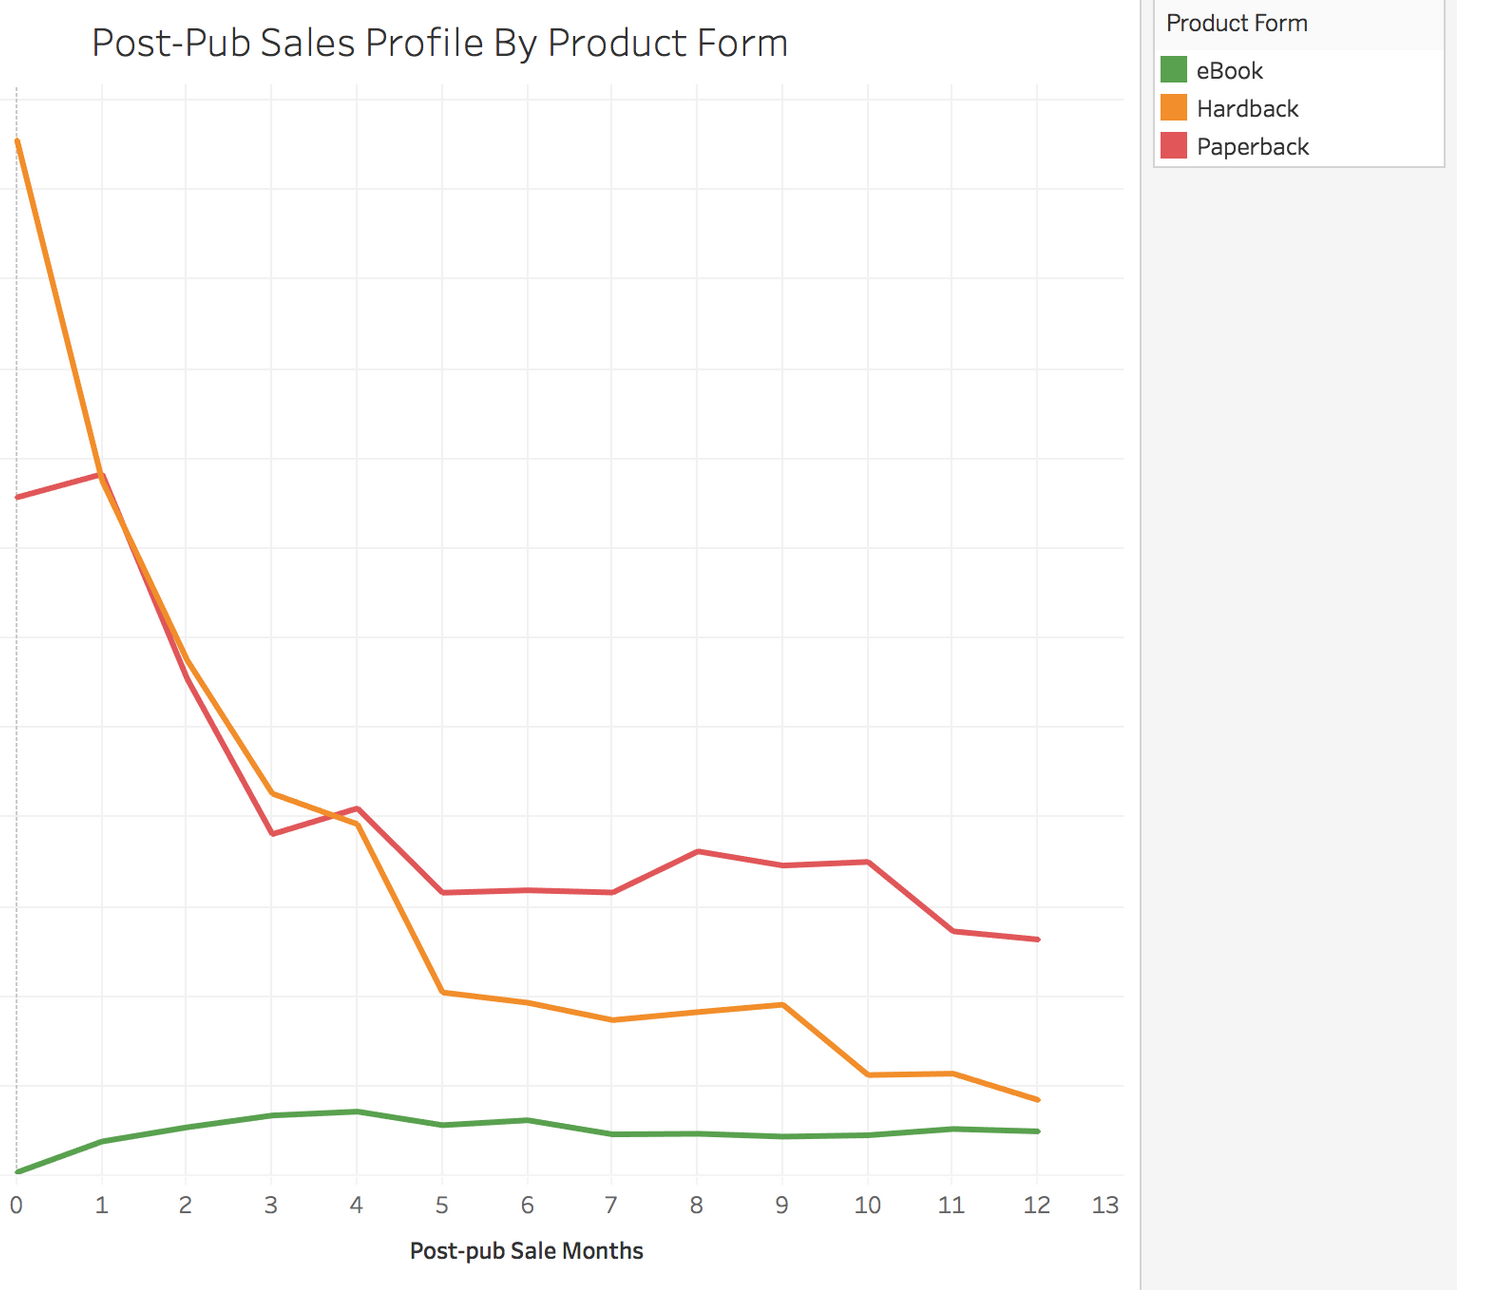
Yes, they do. And that has interesting implications for inventory management – how closely do individual product sale profiles cleave to this average, and how much inventory are you holding ten months after publication?
And do we deliberately publish Christmas-friendly hardbacks in October?
More analysis required…
Forecasts
And just jumping sideways for a moment, here is a simple-to-generate total sales forecast.
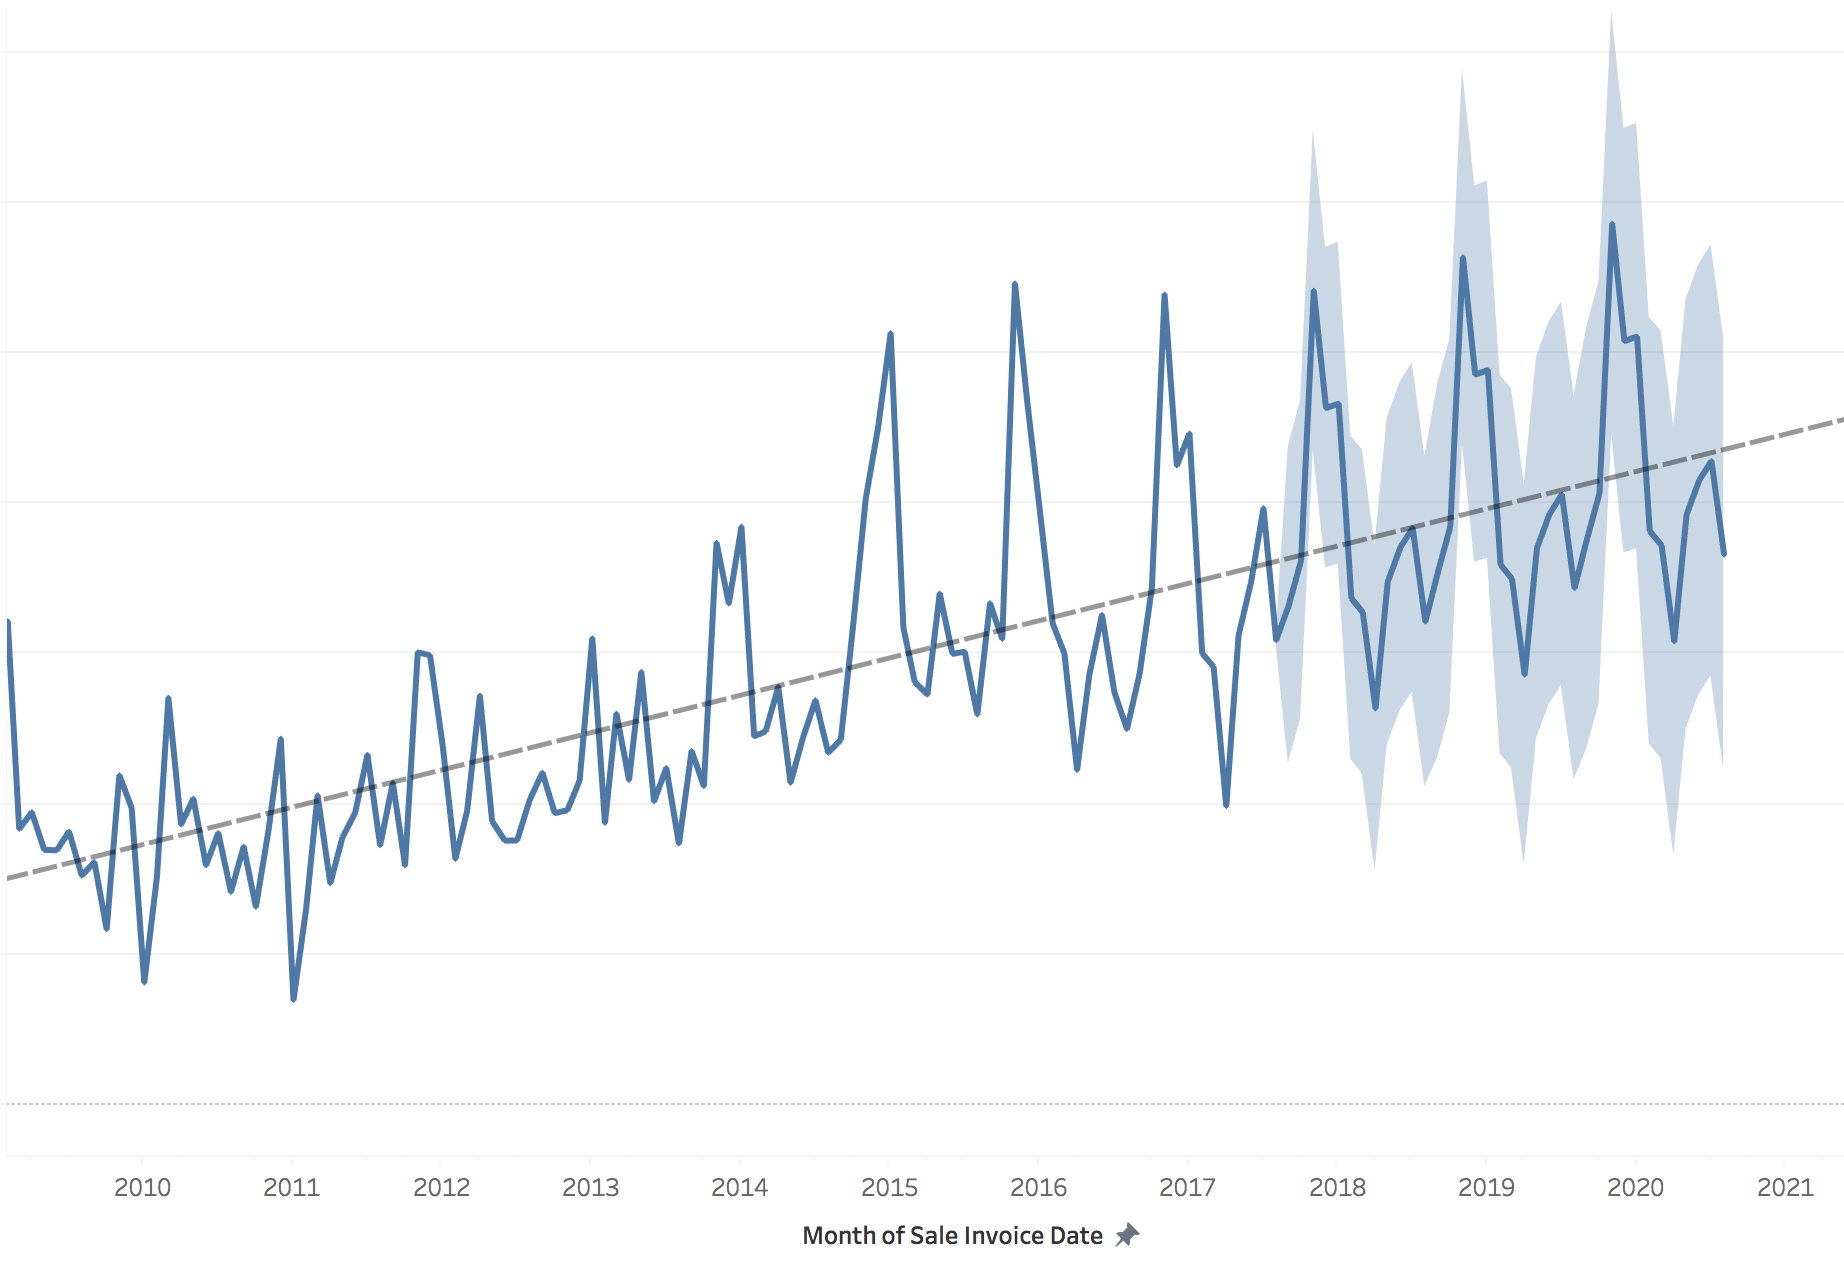
Note how the linear trend and seasonality have been picked out here.
Early Learnings
So here are my conclusions with this mini-project so far.
Firstly, having thought about the range of publishers and their data that we currently store, data exploration of this kind is going to follow a very particular path for each of them. We have non-GB based clients with only a peripheral interest in BIC codes, or who only publish ebooks, or who publish only a few very high value products, and others who have to consider both trade and academic audiences (and who consequently have very different predominant sales channels for different works and products).
Secondly, systems such as Consonance are sitting on an absolutely vast range of data that should be very amenable to analysis, covering metadata, data sharing, sales, inventory, royalties, and when you combine these data sets together you have extraordinary potential for insight. At what stage prior to publication are you sending ONIX to different partners, and how often do different products have data changes? What’s the correlation between values of high-level BIC and BISAC main subject codes? And so on.
But make sure you are using a system that enables you to access that data.
Thirdly, it is entirely possible to do quick and efficient Business Intelligence exploration projects, when you have found the right tools. I’ve enjoyed working with Tableau so far, and the range of free learning materials on their support site has been excellent. If you’re trying to do non-trivial analysis in Excel, stop right now – we have at least two clients who are already using Tableau successfully, so find some time on your schedule to go and get yourself a trial.
And finally, no pie charts.
Are your current systems sabotaging your growth ambitions? Are you hungry to implement new business models, but concerned you lack the strong administrative foundations needed for innovation?
We're always amazed at how resigned publishers have had to become to the low bar in publishing management systems. Demand more.
Contact us via our contact form, or email us.